A DTM is a meshed representation of the ground surface elevation. Relief features include flat areas (zero slope) and depressions that can prevent the downstream flow of water. The aim of hydrological correction of a DTM is to modify the DTM elevations in these areas to ensure a continuous slope from the watershed to the outflow point.

The Fill Sink XXL tool can be used to hydrologically correct the DTM and ensure a continuous slope.
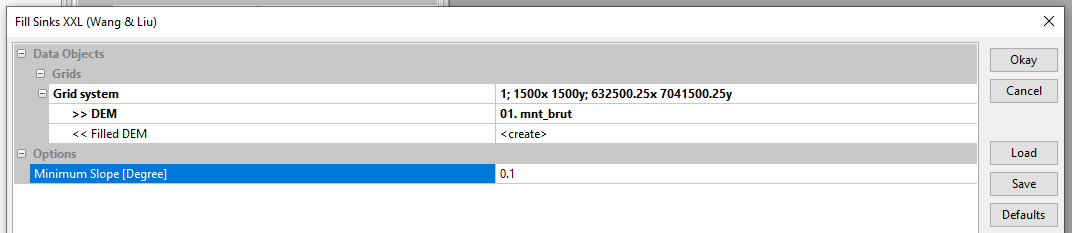
Tools tab <> Tools Libraries <> Terrain Analysis <> Preprocessing <> Fill Sink XXL
Select the Grid System of the mnt_brut grid. Click on DEM and load mnt_brut. The Minimum Slope option lets you set the minimum slope between two meshes. The default slope is 0.1°. Click on OK.
Note : MNT stands for « Modèle Numérique de Terrain » which is the French equivalent for DTM « Digital Terrain Model ».
The corrected DTM appears in the Data tab under the name mnt_brut [no sinks]. Save mnt_brut [no sinks] under the name mnt_fill by right-clicking on mnt_brut [no sinks] then Save as.
/TUTORIEL/PREPROCESSING/TOPOGRAPHIE/mnt_fill.sgrdOptional : Raw DTM / corrected DTM comparison
To illustrate the need for raw DTM correction, the Flow Accumulation tool is used. This tool accumulates values from upstream to downstream according to the slope gradient of each cell. The cells with high accumulation value can be assimilated to runoff axes. Conversely, cells with zero value accumulation are local high zones (e.g. ridges).
Tools tab <> Tools Libraries <> Terrain Analysis <> Hydrology <> Flow Accumulation (Top Down)
Select the Grid System of the mnt_brut grid. Click on Elevation and load mnt_brut. By default, the create tool only creates a Flow Accumulation grid. Different flow routing algorithms can be used via the Method tab. For this example, select Single Flow Direction. Click on OK.
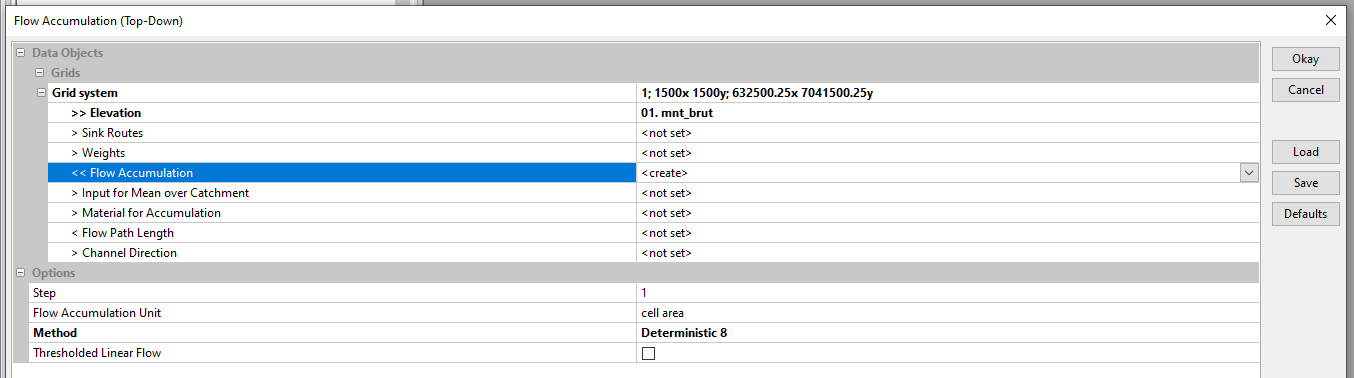
The Flow Accumulation Unit option lets you accumulate either the number of cells or the cell area (1 m² with the DTM used). In this example, choose the cell area option. The tool will accumulate the area of each cell from upstream to downstream according to the slope gradient of each cell. Thus the output Flow Accumulation grid shows the area drained upstream of each cell. To view Flow Accumulation, right-click on Flow Accumulation , Add to Map, select the limite_bv map and click OK.

The Flow Accumulation grid shows interruptions in the accumulation of values due to a non-continuous slope gradient (presence of pits and peaks).
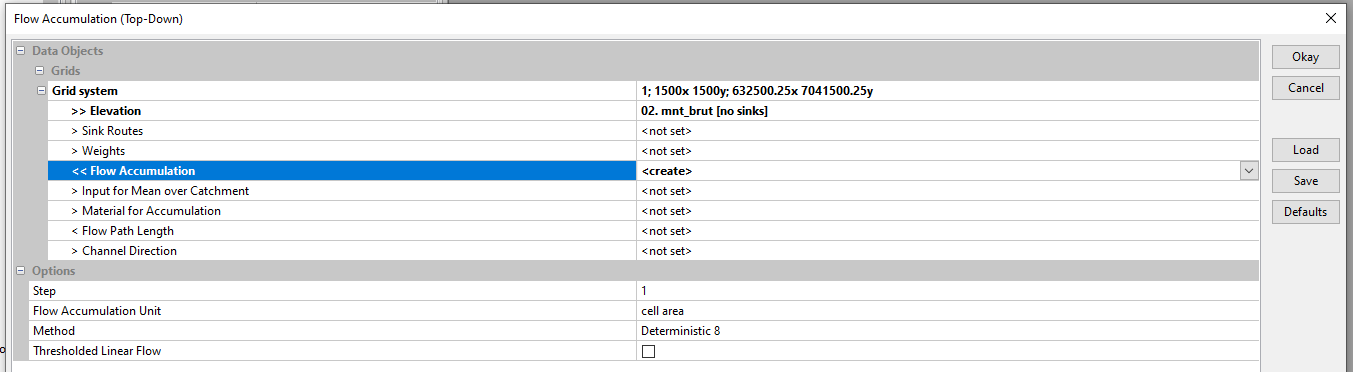
Start again the Flow accumulation tool using mnt_brut [no sinks]. Select the Grid System of the mnt_brut [no sinks] grid. Click on Elevation and load mnt_brut [no sinks]. To avoid overwriting the previously created Flow Accumulation layer, click on Flow Accumulation and select create. Click on OK.
To view the new Flow Accumulation, right-click on Flow Accumulation , Add to Map, select the limite_bv map and click OK.

The Flow Accumulation grid no longer shows interruptions in the accumulation of values from upstream to downstream. From the corrected DTM it is then possible to extract the network of runoff axes. The Flow Accumulation grid can be used to check the organization and direction of runoff.

