Step 1 : Importing from the basin boundary
Unzip tuto_topographie.zip in the directory of your choice.
Open button and point to the basin boundary .shp file. In this example, the basin boundary shapefile is called limite_bv.shp. Click on Open in the bottom right-hand corner of the window.

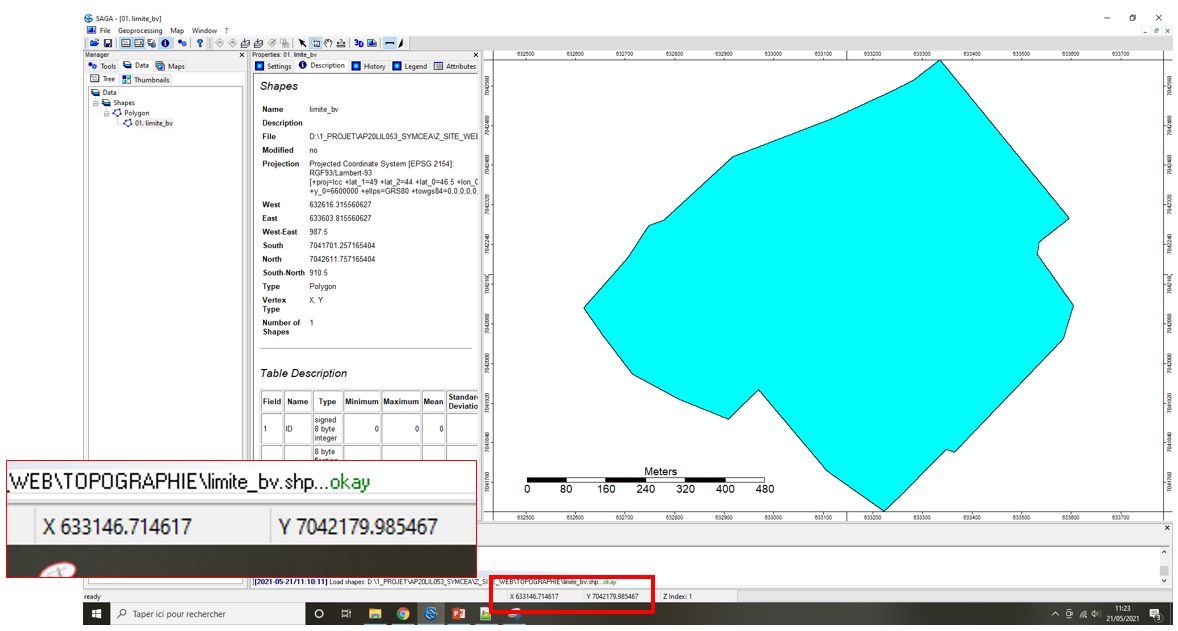
The basin boundary appears in the Data tab. The limite_bv file is automatically filed in Data, Shapes, Polygon. By clicking on limite_bv, the projection system is indicated in the Description tab (in the example, the projection system is Lambert 93). The code EPSG of the projection system Lambert 93 is 2154.

Note: it is imperative that the pool boundary projection system be identical to the RGE ALTI slab projection system.
To display the basin boundary, right-click on limite_bv and Add to Map.

By positioning the cursor at the center of the basin, you can view the associated X and Y coordinates at the bottom of the window. In our example, the X coordinate is 633146 and the Y coordinate is 7042179.
To identify the RGE ALTI tiles covering the basin, simply select the tiles whose origin coordinates are close to those of the basin center. In this tutorial, the 9 RGE ALTI tiles have been pre-selected.
Step 2 : Importation of the RGE ALTI tiles
Open button, then All Files button and point to an .asc file for one of the tiles. Click on Open in the bottom right-hand corner of the window.

Note : MNT stands for « Modèle Numérique de Terrain » which is the French equivalent for DTM « Digital Terrain Model ».
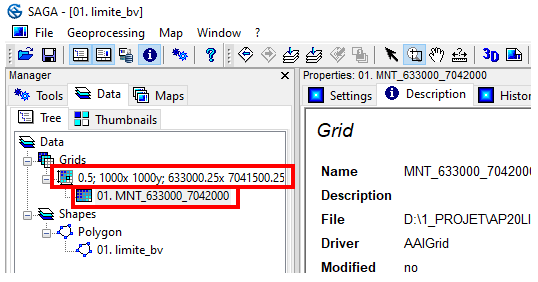
The basin boundary appears in the Data tab and is automatically classified in Data, Grids. In SAGA GIS, each raster tile is classified according to its Grid System. The Grid System describes the tile resolution (0.5), the number of rows and columns (1000x; 1000y) and the X and Y coordinates of the bottom left corner of the tile (633000.25x 7041500.25y).
To display the tile, right-click on limite_bv, Add to Map, Select limite_bv and click OK. The tile appears on the watershed boundary.

Repeat the operation until the entire watershed is covered by ALTI RGE tiles. In our example, 9 tiles are needed to cover the watershed, each with its own Grid System.

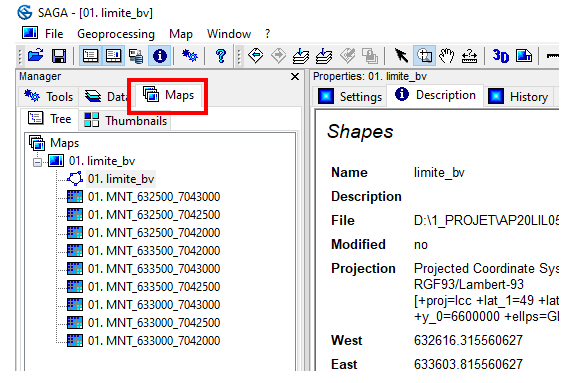
All limite_bv map layers are visible in the Maps tab. The layer’s visibility depends on its ranking in the list. The position of layers can be modified by simple drag and drop. You can deactivate a layer by double-clicking, and reactivate it by double-clicking again.